How unequal is Nepal in terms of income and wealth distribution?
Economic Growth is a measure of the changes in aggregate or average income of an economy. While economic growth essentially captures the growth and performance of an economy, it fails to capture the overall picture leaving out the degrees of inequalities which shapes out the actual levels of growth in a broader perspective. There has been a significant economic growth in the case of Nepal as well, with the GDP growth rate estimated to be 3.9% in 2024 by World Bank; but it does not necessarily capture the overall growth of the entire population.
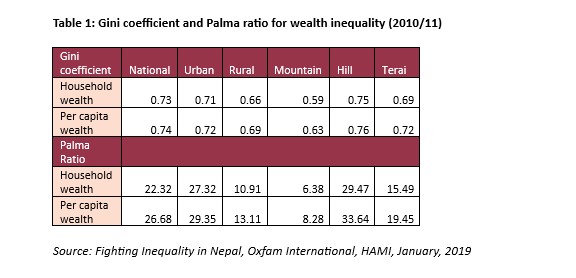
The Gini coefficient, which is named after the Italian Statistician measures the wealth and income distribution in a society from a score of 0 to 1. The score of 0 means perfect income equality, while the score of 1 represents perfect income inequality. In 2010/11, Nepal had one of the highest income Gini coefficients in the world at 0.49, with the income inequality increasing considerably in the following years. The income Gini coefficient then reached 0.58 when it was measured in 2019, which represents the growing income inequality in Nepal. The Gini coefficient for wealth inequality in 2010/11 is even higher than the income Gini coefficient at 0.74 portraying the status of extreme wealth concentration in Nepal.
Similarly, Palma Ratio which measures the share of all income received by the 10% people with highest disposable income divided by the share of all income received by the 40% people with the lowest disposable income, shows a similar trend for Nepal. Currently, the income of richest 10% of Nepalis is more than three times than that of the poorest 40%. Similarly, the richest 10% of Nepali have more than 26 times the wealth of the poorest 40%.
Factors contributing to income and wealth inequality in Nepal
The rise of inequality over the years from Gini coefficient of 0.49 in 2010/11 to 0.58 in 2019 is also a consequence of the rise in import dependency of Nepal. The share of total imports has reached NPR 1.612 trillion (USD 12.13 billion) while the total export is only NPR 157 billion (USD 1.18 billion) in FY 2022/23 AD (2079/80 BS). The import/export ratio increased by 6.83% to 10.26 as compared to the previous fiscal year. Nepal shifting away from reducing import-export ratio suggests a loss of employment for majority of domestic workers and displacing the business sector with direct involvement of poor and middle-class people.
Privatization and commercialization along with cuts in government spending like education and health has led to an expansion in the inequality gap between the rich and the poor. The rich majority could possibly afford the lucrative fees of private hospital in the capital, but the situation is not the same for the poorer counterparts especially in rural regions. The people in rural region are starved of funding and political support, yet such public services are the only option for the people with low income.
Nepal has a critical situation of health inequality as health facilities has not been able to reach the entire population. Around 60% of the rural households require over 30 minutes to reach the nearest government health facility. Similarly, two-thirds of children in Nepal attend public schools where only 30% of the total students stay in school while the rest 70% drop out of the school system.
Moreover, the political scenario of Nepal is another major driver of inequality. The money and power are concentrated in the hands of a few rich individuals leading to exercising of excessive influence and skewing of policies in their favor. Such groups of individuals and business have little to no incentive in raising tax levels and transparency which has led to rampant corruption ranking Nepal 110 out of 180 countries on the Transparency International Corruption Perceptions Index (CPI).
Remittance in Nepal and how has it impacted inequality
With an average per capita GDP of about USD 1336.5 (NPR 177,460), and USD 4726.6 (NPR 627,598) in purchasing power parity, Nepal is among the poorest country in Asia. But despite that, Nepal has made significant improvement in the Multidimensional Poverty Index (MPI) from 30.1% Nepal Multiple Indicator Survey (NMICS 2014) to 17.4% (2019 NMICS) in a span of just 5 years. The improvement in MPI, along with improvement in Balance of Payments (BoP), and maintenance of foreign currency reserve is credited to a significant increase in the inflow of remittances from migrant workers.
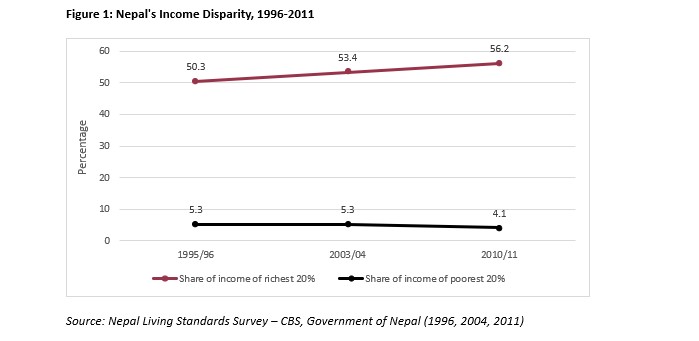
Remittance inflows play a vital role in raising the living standards of the recipient families and reducing the aggregate poverty in Nepal. Remittance received by the targeted households could contribute to reduction in poverty especially in rural areas. Even though remittance has helped in bringing the poverty level down, there are still very high levels of inequality present, where the income share has increased for only the richest fifth of Nepal’s population, while the income share decreased for everyone else in the five years leading up to 2010/11. Remittance has helped in the reduction of poverty ratio by 5.3%, the poverty gap has deepened by 7.37% and severity by 9.25%. Overall, remittance has elevated the living standards and economy of the remittance receiving group, but it has consequently contributed to raising income inequality when it comes to non-remittance receiving group.
Way Forward
A society is never free from inequalities to an extent. But the focus should be on elevating the standard of living so that no one should ever fall into poverty trap or live below the accepted standard of living. That is where the role of the government comes into play.
The fiscal policy adopted by the government is one of the most important tools to tackle inequality. Redistributing resources through design and raising money to tackle inequality can be accomplished through fiscal tools like progressive taxation and effective reinforcement. But sadly, regressive taxation, large tax exemptions, and low rates and tariffs define Nepal’s tax structure. Value Added Tax (VAT) has increased as a share of goods and services from 30.4% in 1989/90 to 47% in 2014/15. Such regressive taxation places unequal burden on the poorest group of the society. There are evidences that the poorer households are the ones having to suffer due to these indirect taxes. Nepal is also missing out on implementing wealth and property taxes which could level the playing field by making the tax system more progressive and increasing revenue for the redistribution of income.
Moreover, the government should also focus on spending on public services and other social programs like health and education to tackle poverty and inequality. The poor majority are the direct beneficiaries of such public services as they cannot afford the affluent fees of private counterparts. There are evidences that free health and education systems play a major role in reducing economic inequality.
Yet, the health and education sector are severely underfunded. Health spending fell from 7.8% of total spending in 2011/12, to just 4.79% in 2023/24, and education spending dropped from 18.3% to 11.25% in the same period. It is high time that the government invests in the necessary policies to meet the needs of every citizen and fight economic inequality. Adults with higher levels of education tend to be healthier and live longer as compared to their less educated counterparts, and the differences are significant and growing.
Mahotsav Pradhan holds a Bachelor’s degree in Economics (Honors) from the University of Delhi. Prior to joining Nepal Economic Forum as a Research Fellow, he has worked as Foreign Exchange Intern at Nepal Rastra Bank. He has a keen interest in development economics, with a passion for exploring the dynamics of policy analysis and international finance.