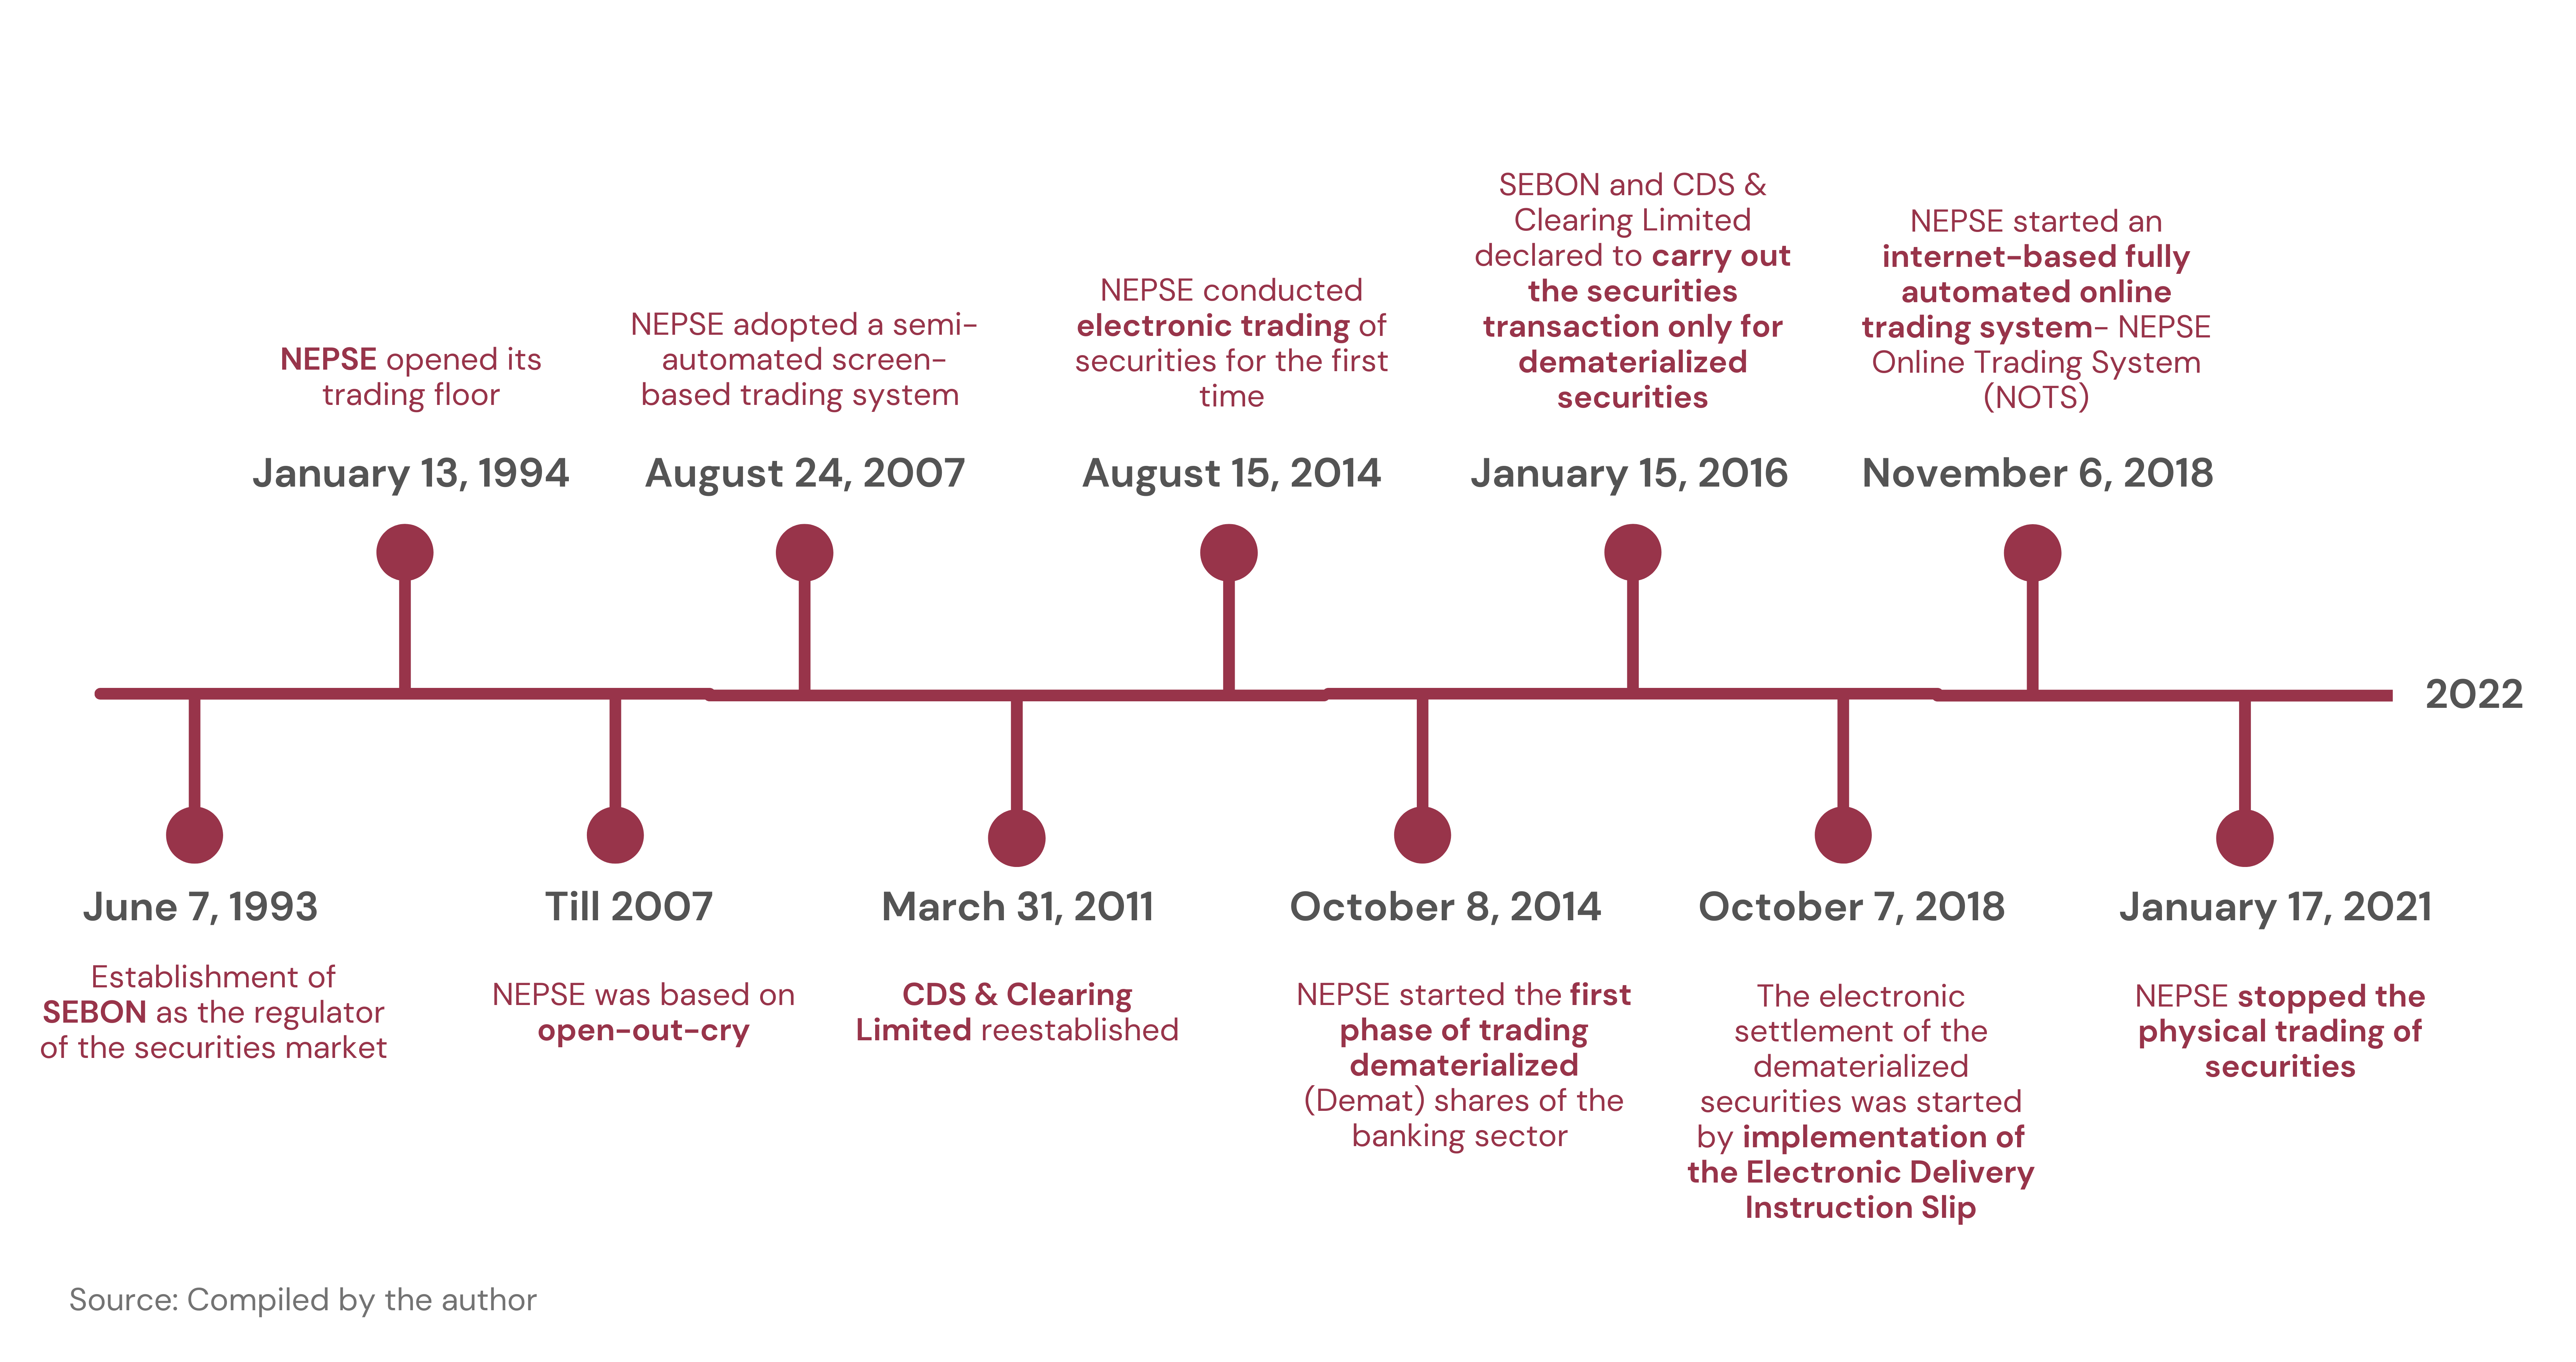
Nepal Stock Exchange Ltd. (NEPSE) is the only stock exchange of Nepal for the secondary market that provides a platform for investors to buy and sell shares of publicly traded companies in various sectors in Nepal. It was established under the Companies Act-2006 and operates under Securities Act-2007. The stock market has since gone through a paradigmatic shift (refer to Figure 1).
Figure 1. Brief history of Stock Market in Nepal
Stock Market Growth Indicators
Some of the indicators that can be looked at to evaluate the stock market growth are liquidity, market size, and index performance.
Liquidity: Share market liquidity can be interpreted from the total turnover. Total turnover is calculated by dividing the value of total shares traded by market capitalization. Higher turnover often indicates higher liquidity in the share market (Bepari and Mollik, 2008), meaning it is easier to sell stock in the share market. In 2019/20, total share turnover increased by 36% from NPR 110.07 million to NPR 150.04 million. It further increased by a whopping 869% in 2020/21, when it reached NPR 1454.44 million. The share market saw another significant increase in the total turnover in 2006/07 and 2007/08, when turnover increased by 142% and 173%, respectively. Similarly, the turnover increased by 54% in 2011/12, followed by 114% in 2012/13 and 251% in 2013/14. This increase in turnover shows an increase in the total trade relative to the market size and an increase in liquidity in the Nepali stock market over time. The trend line in Figure 2 forecasts a gradual increase in turnover over the next four years.
Figure 2: Share turnover in Nepal Stock Market, 2003-2021 (with four years forecast)
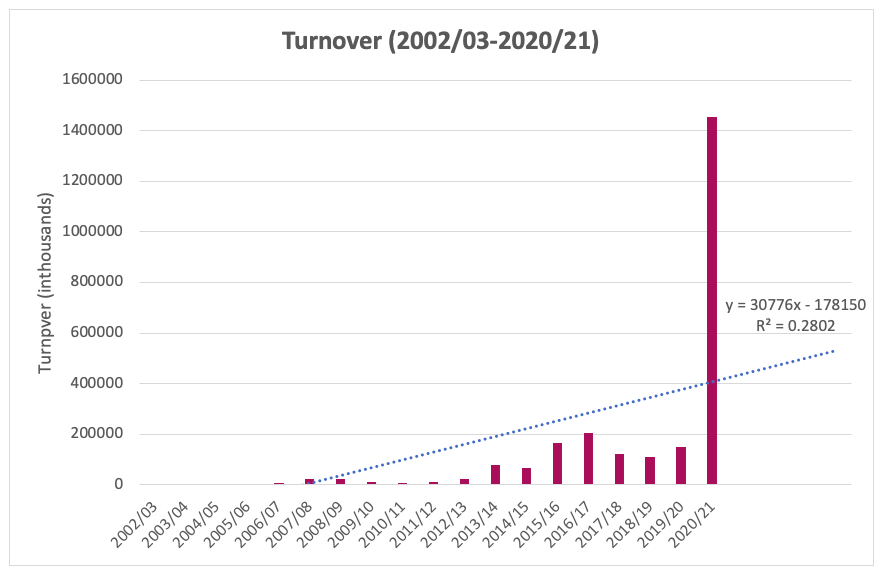
Source: Nepal Stock Exchange Annual Reports
Market Size: An indicator that measures market size is the number of listed companies. In 2020/21, the number of companies listed in NEPSE increased from 212 to 219 companies. It also increased by 19% in 2010/11, when it reached 209 companies. The total listed companies reached an all-time high of 233 in 2013/14.
The number of transactions in 2020/21 increased significantly from 1.85 million to 15.42, a 734% increase. Another significant increase was observed in 2003/04 when it reached 85.6 thousand – a 272% increase compared to 2002/02. Similarly, the number of transactions increased significantly from 2013/14, when it increased by 94%, and in 2015/16 when it increased by 75%.
It is interesting to note that the total market capitalization of Nepal has been increasing over the years. Market capitalization increased by 124% in 2020/21, when it increased from NPR 1.79 trillion in 2019/20 to 4.01 trillion in 2020/21. Market capitalization also increased significantly in 2006/07 and 2007/08, respectively, by 92% and 97%. Another significant increase was seen in 2015/16, when the market capitalization increased to NPR 1.06 trillion, compared to NPR 0.99 trillion in 2014/15, an increase of 91%.
Looking at the market capitalization-to-GDP ratio, in addition to the stock market size, it can be determined if the given stock market is valued accurately in accordance to a historical average by comparing the value of all the listed stocks to the value of the country’s total output. The ratio is calculated by dividing the stock market capitalization of an economy divided by the economy’s GDP. Usually, a ratio higher than 100% shows that the market is overvalued, and a ratio between 90% and 115% are considered modestly overvalued. The market capitalization to GDP ratio of Nepal is 93.4%.
Performance: NEPSE index points are an indicator that can be used to analyze the performance of the Nepali stock market. An increase in the NEPSE index refers to the bullish stock market. NEPSE index increased from 1362.4 points in 2020/21 to 2883.41 points in 2021/22, a 1521.01-point increase. Similarly, another significant change was seen in 2013/14, when the index increased by 517.77 points. In 2006/07 and 2007/08, other significant changes were seen when the index increased by 297 and 279.41 points, respectively.
Trends and Growth Factors
A trend can be observed in Nepal’s stock market performance based on the indicators mentioned above. The indicators have grown significantly in 2007, 2008, 2011, 2014, 2016, and 2021. The growth in 2007 and 2008 can be linked to NEPSE’s adoption of a semi-automated screen-based trading system, which replaced the open outcry system. Similarly, the growth in 2011 can be attributed to the establishment of CDS & Clearing Limited (CDS). CDS provided a centralized depository, clearing and settlement services in Nepal and started dematerializing the share market, which had a long-term impact on the market. A similar increase was seen in 2013-2014, when NEPSE conducted electronic trading of securities for the first time and initiated dematerialization. The growth in 2021 is the result of the establishment of NEPSE Online Trading System (NOTS). These transformational changes all have a common theme – digitalization.
Digitalization allowed investors to place their orders online and carry out trading, clearing, and settlement electronically, making transactions more transparent and convenient for investors. Before the introduction of NOTS, investors had to place their orders to buy or sell a stock via phone calls to their brokers. However, since the introduction of NOTS, investors can now buy and sell stocks through a platform called Trade Management System – an account provided by their broker. Even though brokers are still involved in the process, their involvement has been minimized, saving investors a lot of time. This has decreased the process of trading stocks from at least a week to three days.
In addition to digitalization, COVID-19 encouraged investments in the stock market and made a significant impact on the market performance. COVID-19 led to a halt in economic activities, as businesses in many sectors shut down or halted operations. Post-COVID-19, many people started using the capital market as a passive source of income, which created a more active stock market.
Furthermore, the level of financial literacy in Nepal has increased over the years, with many educational institutions now educating students on the stock market and individuals sharing insights and fundamental knowledge through social media platforms such as the Clubhouse. Easy access to news and information relating to the capital market through platforms such as sharesansar and nepalipaisa has contributed to investors’ confidence.
These factors combined have led to an increase in both trading activities in the capital market, and the number of Nepalis entering the share market. In 2020/21, the number of Demat accounts increased by over 1.5 million units. As per the CDC, Demat account has reached 4,895,021, and the number of dematerialized shares has reached 8,012,542,328. The number of Demat accounts increased from 1.48 million in FY 2018/19 to 3.79 million at the end of FY 2020/21.
Way Forward
The stock market trends and the growth in the important share market indicators goes to show the importance of digitalization in the Nepali stock market. With increasing financial literacy and the estimated increase in remittance inflow in the country, the number of active traders in the Nepali stock market has a potential to further grow. The number of companies applying and getting approved for an initial public offering (IPO) has also increased, indicating that a lot of companies are entering the secondary market. Making the online platform (TMS) easier to maneuver, increasing financial literacy, and providing incentives for foreign migrants to enter the Nepali stock market may increase the number of investors in the market. While the initial improvements in the platform have had a big impact on attracting Nepali people towards the capital market, Nepal has potential for development in terms of increasing the convenience for investors.
Aarya Rijal is a recent graduate with a B.A. in Economics from Union College, USA. Her key interests are in corporate finance, macroeconomics, and international economics. Before joining NEF, Aarya worked as a student data analyst and a research assistant at Union College. She is currently working as a fellow at NEF.