On August 26, 2026, a mass of ice and rock broke loose near Langtang Lirung and slammed into the Lhende Khola. What followed was not a flood in the ordinary sense, it was a wall of water, mud, and debris that tore 72 kilometers down the Trishuli River corridor, through Rasuwa, Nuwakot, and Dhading, crossing the Nepal-China border at Gyirong Port along the way. As of this writing, 1,386 people are confirmed dead in Nepal alone, more than 5,130 remain missing, and nearly 150,000 people have been directly affected by the flood (a toll that officials say is still climbing, and that the government’s own disaster authority updates daily). Nepal’s disaster authority has priced the property damage at over NPR 400 billion, with the final assessment expected to land roughly 30% higher.
That is nearly a tenth of the country’s entire economy.
And yet, if history is any guide, next year’s GDP figures will likely look unremarkable, perhaps even strong.
Methodology
To test whether Nepal’s disasters actually derailed its economy, or merely appeared to, this analysis draws on three sources of data spanning 15 years. In which, GDP growth and consumer price inflation (CPI) indicators for Nepal were collected from World Bank national accounts data, covering the years 2011 through 2025, with preliminary 2026 figures drawn from International Monetary Fund (IMF) and World Bank estimations as they became available. GDP growth reflects the annual percentage change in the real value of goods and services produced; CPI inflation reflects the annual percentage change in the cost of a fixed basket of household goods and services. These two indicators were plotted together on a single timeline (Figure 1) to allow year-by-year comparison. Gross national income (GNI) per capita, also sourced from World Bank national accounts data from 2011–2025, which was plotted separately as its annual percentage change (Figure 2), to allow direct comparison against the GDP growth line without the two indicators overlapping on one chart. Disaster events across the same period were compiled separately from Nepali government and news sources and layered against both timelines for reference.
The Puzzle
The expectation that GDP will hold steady is not a prediction born of optimism. It is a prediction born of pattern. What follows is 15 years of Nepal’s GDP growth (how fast the economy grew) and consumer price inflation (how much prices went up), laid against 15 years of disaster
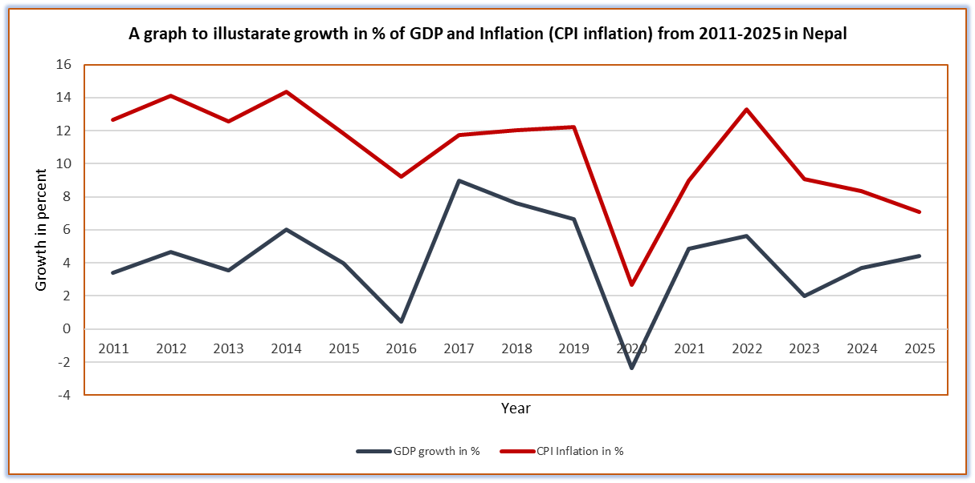 Figure 1. Nepal GDP growth and CPI inflation, 2011–2025.
August 2026 doesn’t appear on this chart yet. But look instead for 2017, when floods across the Terai killed 134 people and cost the country USD 585 million. Look for 2021, the year a debris flow erased much of the town of Melamchi. Look for 2022, when a landslide in Achham and floods across the Karnali basin killed dozens and displaced 80,000 people. None of those years produced a visible dip in the chart. In fact, 2017 was one of the best growth years on the entire chart. 2021 looks like a smooth, healthy recovery.
Only two moments on this chart are impossible to miss: 2015, when growth crashes down to almost nothing, and 2020, when it actually goes below zero, the only time that happens in 15 years. The huge 2015 earthquake, and the 2020 COVID-19 pandemic are major events to highlight that could affect GDP growth. Everything else on this list, years and years of disasters, deaths, families losing everything barely leaves a mark on this chart. That is not because those disasters didn’t matter. It is because of how GDP is built, which most people never think about.
A Decade of Disaster, Barely on the Record
Since 2015, Nepal has not gone a single year without a major disaster. The Gorkha earthquake killed 8,979 people and destroyed roughly a third of the country’s annual economic output in a single day. Before the rubble had even been cleared, an unofficial border blockade with India, lasting from September 2015 to February 2016, cut off fuel, medicine, and building material exactly when reconstruction needed them most, compounding the earthquake’s damage with a second, largely man-made shock to the same fiscal year. Two years later, the 2017 Terai floods submerged as much as 80% of the low-lying plains in the worst-hit districts. In 2019, monsoon rain was so heavy that officials had to open every single gate of the Koshi Barrage, a giant dam-like structure in southeastern Nepal, just to keep it from bursting. In 2020, floods and a pandemic arrived together. In 2021, the Melamchi flood, Nepal’s worst wildfire season on record (with about ten times the normal number of fires), and floods in western Nepal all happened within the same year. 2022 brought the Achham landslide and Karnali floods. In November 2023, a second earthquake, this one in Jajarkot killed 153 people. 2024 saw Nepal’s second-worst wildfire season on record and, that September, the heaviest rainfall Kathmandu Valley had recorded since 1970. 2025 brought a glacial lake outburst flood at Rasuwagadhi that swept away the Nepal-China Friendship Bridge, followed months later by floods and landslides across eleven eastern districts. And now, 2026.
If we total the deaths across this list, the count goes well past 15,000 people, and that’s not even counting the more than 5,000 still missing from August this year alone. Summing up the recorded losses, the figure runs into billions of dollars, spread across a decade and a half. None of that is in dispute. What is worth asking is why, if you only looked at the GDP line, you would barely know most of it happened.
The Mechanism: What GDP Was Never Built to See
Part of the answer is a feature, not a flaw, of how gross domestic product is measured. GDP counts the flow of goods and services produced within a period; it does not subtract the stock of wealth a disaster destroys. When the Gorkha earthquake destroyed hundreds of thousands of houses, that loss enters no GDP ledger directly. The homes that existed on April 24, 2015, and the rubble that remained on April 26 show up as no negative number anywhere in the national accounts. But here’s the twist: when the government, aid groups and families start rebuilding, buying cement, hiring workers, repairing roads, every rupee spent on that rebuilding does count as economic activity. It gets added to GDP as if it were new growth.
There’s an old, simple story economists use to explain this, first told by the French economist Frédéric Bastiat, nearly 200 years ago: imagine a kid throws a rock and breaks a shopkeeper’s window. The shopkeeper must pay a glassmaker to fix it. That payment counts as an economic activity: the glassmaker earns money, and that money moves through the economy. But obviously, the town is not richer because a window was damaged. The shopkeeper just spent money on a repair he wouldn’t have needed otherwise, instead of spending it on something new, like inventory or a vacation. Economists call this the “broken window” idea, and it’s a big part of why Nepal’s GDP growth in the year after the 2015 earthquake shot up to almost 9%, the single best year on the whole chart. Nepal didn’t magically heal from the earthquake in 12 months. It spent enormous amounts of money rebuilding what the earthquake destroyed, and all that spending got counted as “growth.”
By 2018 and 2019, that boost from rebuilding was fading out, not because a new disaster hit but simply because most of the rebuilding money had already been spent, so there was less of that extra spending left to count. The 2017 floods happened right in the middle of this slow-down, but it is not visible on the chart, instead they’re hidden inside a trend that was already heading downward for a completely different reason.
A related but more complicated pattern played out after COVID-19. The 2020 collapse is real and severe, but the 2021 rebound is not simply Nepal healing. Part of it is arithmetic, a low base year mechanically makes the following year’s percentage growth look larger, even before output has fully recovered. And part of it is that Nepal’s central bank made it much easier for people and businesses to borrow money in 2020 and 2021, to help the economy survive COVID. A lot of that borrowed money was spent on consumption and import. You can see this on the chart: 2021 to 2022 is the one stretch where both GDP growth and prices (CPI inflation) go up together, cleanly. When people borrow and spend a lot of extra money all at once, both things tend to happen at the same time i.e., more goods and services get bought (which shows up as growth) and prices get pushed up too (because everyone’s competing to buy the same limited goods and services). Economists call this “demand-pull” cycle, demand pulling both GDP and price upward together.
There was a second force pushing prices up in 2022 that had nothing to do with Nepali credit policy. In February of that year, Russia invaded Ukraine, and the war knocked out a large share of the world’s wheat, fertilizer, and crude oil supply. Global fuel and food prices spiked to some of their highest levels in decades, and because Nepal imports almost all its petroleum and a good share of its chemical fertilizer, that shock landed at Nepali pumps and dinner tables directly. Nepal’s own inflation climbed to an 8.64 % year on year peaking in September 2022, a 74-month high on record with petrol, diesel, cooking-oil, and fertilizer among the sharpest movers.
However, it did not last. By 2022, that same credit-fueled import surge had drained Nepal’s foreign exchange reserves badly enough to trigger a crisis. This forced the central bank to slam the brakes: it tightened credit (making borrowing harder) and restricted certain imports. Growth fell to under 2% the very next year, not because of any disaster, but because of a policy correction to an imbalance the credit boom itself had created. Notice that growth and prices move together again here too, just both falling this time, for the same reason: the same lever that pushed them up together in 2021 got pulled back down in 2022. Compare that to 2017-2019 and 2023-2025, where growth and inflation move in opposite directions instead of together, a sign that something other than simple borrowing and spending (more likely rebuilding money, commodity prices, or gradual policy easing) is driving the numbers in those periods.
Why the Earthquake Shows and the Floods Don’t
Scale is most of the explanation. The 2015 earthquake caused damage equivalent to roughly a third of GDP in a single event, large enough that no amount of reconstruction accounting could fully absorb it. Most of Nepal’s other disasters, devastating as they are for the families affected and districts involved, are relatively small to a national economy running into the trillions of rupees. The 2017 floods, at USD 585 million, amounted to roughly 1% of that year’s GDP, real, painful, and almost entirely invisible against the noise of everything else moving the national number that same year.
There’s also a simple averaging problem. National GDP is one single number for the whole country. A flood that wrecks a district like Sindhupalchok or Achham is enormous for the people who live there, they lose their homes, their farmland, their income. But once you average that damage against everything happening in Kathmandu, and every farm in the rest of the Terai, and every business everywhere else the flood didn’t reach, it almost disappears. The same thing happens with prices: a flood might make vegetables much more expensive in one province, but if that’s a small part of what the whole country buys, or if the gap gets filled by bringing in food from somewhere else, the national inflation number barely moves even though one family’s grocery bill just went up a lot.
None of this means Nepal’s economy is resilient to disaster. It means the instruments used to measure the economy are built to average out exactly the kind of shock these disasters represent. Resilience and invisibility are not the same thing, and treating one as proof of the other is a quiet way of deciding that a cost doesn’t count.
Who Actually Pays: A Closer Look at Household Income
There is one line that tells a more honest story about who bears these costs directly. Gross national income per capita, which is just a rough estimate of how much an average Nepali household actually earns in a year. It moves somewhat like GDP, but not the same way.
That gap matters most in exactly the years this piece has been describing. GNI per capita is not smoothed by reconstruction spending the way GDP is, when a flood destroys a family’s crop or a shopkeeper’s stock, their income falls that year, even if the national accounts eventually recover the loss through someone else’s rebuilding budget the following year. For the families who lost income earners, farmland, or homes in Rasuwa, Nuwakot, and Dhading this August, the growth figure Nepal reports for 2027 will describe very little of what actually happened to them. However, no matter how healthy that figure looks sitting next to 15 years of chart lines that, taken alone, suggest an economy that barely stumbled.
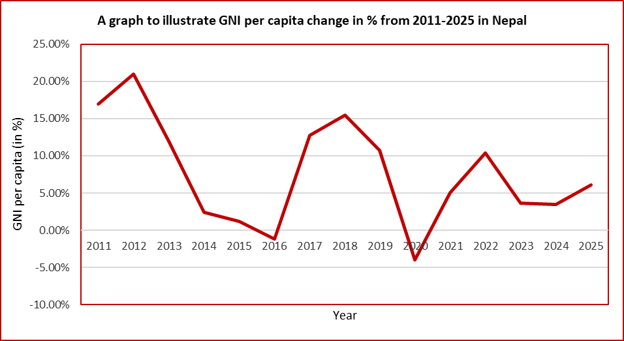
Figure 2. Nepal GNI per capita, annual change (%), 2011–2025.
Look at 2023: household income growth drops to 3.56%, way down from 9.89% the year before, right around the same time GDP growth is also slowing down. The timing matches well with the central bank’s 2022 credit tightening, showing up in people’s paychecks about a year later. However, it would be unfair to blame the tightening alone, as exchange-rate movements and global remittance trends likely did at least as much work as domestic credit policy. But the direction is consistent with the broader pattern: when the state pulls back demand to defend its reserves, it is ordinary households’ income growth, not only the abstract GDP figure, that absorbs the slowdown.
2026: The Live Test
This brings us back to August 2026 and to something we genuinely don’t know yet as it is too soon to forecast flood accounted data as it is still ongoing.
Nepal’s growth had already slowed sharply after the Gen-Z led protests of September 2025. The recovery everyone was counting on this year depended on politics staying calm after the March 2026 elections, not on recovering from a natural disaster. The World Bank’s April 2026 forecast reflects exactly that: just 2.3% growth this year, recovering to an average of 4.4% over the next two years, built on the assumption that political unrest, not a flood, was the main obstacle standing in the way. The IMF’s own June 2026 forecast was similarly hopeful, growth near 3% this year, 4.6% next and it openly pointed to recovery from the 2025 protests and a calmer political mood as the reasons for that optimism.
The flood arrived before that recovery had even started. Both forecasts are now out of date. Whatever comes next will have to account for two shocks stacked on top of each other, not one: a political crisis Nepal was just beginning to move past, followed almost immediately by the most expensive natural disaster the country has faced in over a decade.
Based on everything explained above, here’s what the historical pattern would predict: if this disaster follows the same path as 2015, expect this year’s growth number to drop sharply, followed by an unusually strong “recovery” the year after, driven almost entirely by reconstruction spending. That so-called recovery will look great on paper. But it will just be the government spending money on rebuilding that it had originally planned to spend on something else.
This time, we don’t have to guess how big that trade-off is, it’s already being measured. Nepal’s entire economy is projected to be worth roughly USD 48.1 billion next year. The billions of dollars required to foot the rebuilding costs will certainly take a toll on the government’s plans for new investments in the future. Every rupee spent rebuilding a bridge in Rasuwa is a rupee that was not available for the school, the irrigation canal, or the new hydropower plant the budget had planned to build. This is the broken-window idea again, except this time, the damage might finally be big enough to show up in the topline number, instead of hiding behind it.
The Forecast, and What It Does Not Show
Over the 15 years, data has shown us that Nepal’s path to recover is strong. Based on this analysis, incoming data will show Nepal’s 2026 GDP will most likely fall, or at best flatten, after August 26. Nevertheless, the following year it will swing back: reconstruction spending on farmland, homes, roads, and power stations will pour in, and within twelve months or so the GDP line will likely show something that looks like recovery, maybe even outright growth. That is not Nepal healing. It is the broken-window effect doing what it always does, turning the cost of rebuilding into a number that reads as progress, while the lost income, hydropower revenue, and the families left without a primary earner stay invisible in the data. That gap between the data and the lived reality is not new, and it is not small. In 2011, Nepal’s GDP grew 3.2%. 15 years, two earthquakes, a pandemic, a border blockade, a foreign exchange crisis, and a decade of floods later, 2025’s growth rate stood at 4.1%, an increase of less than one percentage point across the entire period, disaster, rebuild, disaster, rebuild, cancelling out almost exactly.
Therefore, to answer the initial question, the people of Rasuwa, Nuwakot, Dhading and many more lived a different reality. A reality of homes, income and livelihood vanished in an afternoon and never fully recovered, and that repeatedly occurred on loop over 15 years whilst making these setbacks barely invisible on paper. Here the disconnect is large that Nepal’s national accounts will keep telling a story of a resilient, steadily growing economy, because that is the only story this measuring instrument knows how to tell.

Shubham is a BBA (Honors) Finance student at Kathmandu University School of Management. His interests lie at the intersection of development finance, economics, financial markets, and applied research. He is particularly interested in evidence-based economic policy, sustainable development, corporate governance, and the role of financial systems in fostering inclusive economic growth. Whereas, Sunita Shahi is currently an intern at the Nepal Economic Forum. She recently completed her Master's in International Development, specializing in Governance and Inequality, at IE University. She is interested in analyzing development challenges across developing countries, with a focus on how governance structures shape inequality outcomes. Her previous work includes a role in the strategy department at Ogilvy Dubai, where she collected primary data and developed recommendations based on her findings.